New GRE 2011 Data Interpretation Sample Questions - 2

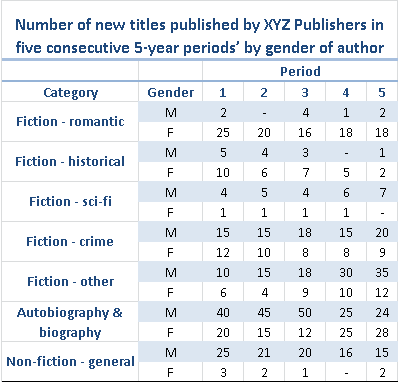
Refer to the above table of numbers of authors and titles for XYZ Publishers.
Solve these questions:
1. Over the whole five 5-year periods shown in the table, in which of the categories below does XYZ publishers publish the greatest number of new titles?
A. Fiction – crime
B. Fiction – historical
C. Fiction – other
D. Autobiography & Biography
E. Non-fiction – general
2. In how many of the categories shown on the table does the number of new titles by female authors exceed the number of new titles by male authors in the ten-year period represented by periods 4 and 5?
A. 1
B. 2
C. 3
D. 4
E. 5
3. Which of the following can be correctly deduced from the table? (Select ALL that apply)
A. In the Fiction – sci-fi category over the 25-years depicted in the table the ratio of new titles by female authors to those by male authors is 1:6
B. The average (arithmetic mean) number of titles published each five-year period in the category Fiction - Historical is 8.6
C. The total number of new titles published in period 5 is greater than the total number of new titles published in period 1
4. If the gender ratio is defined by the publisher as the number of new titles published by male authors divided by the number of titles published by female authors, then, in Period 3, in how many of the seven categories shown in the table is the gender ratio less than or equal to 2?
A. 1
B. 2
C. 3
D. 5
E. 6
5. Which of the following figures is the closest to the value of new titles in the Fiction-romantic category in period 5, as a percent of new titles in all the Fiction categories in Period 5?
A. 30
B. 22
C. 20
D. 15
E. 12
