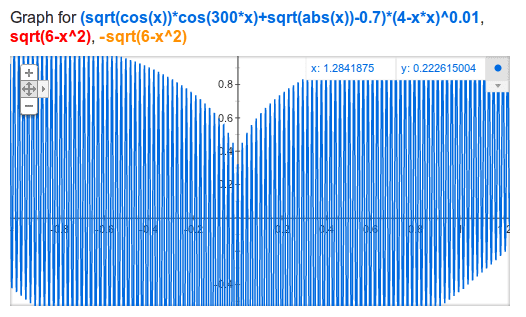
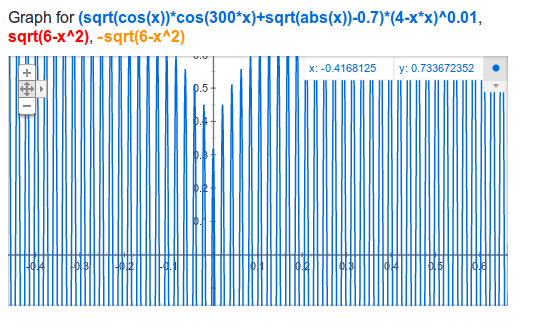
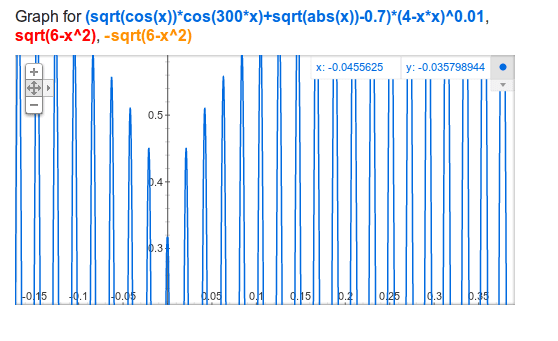
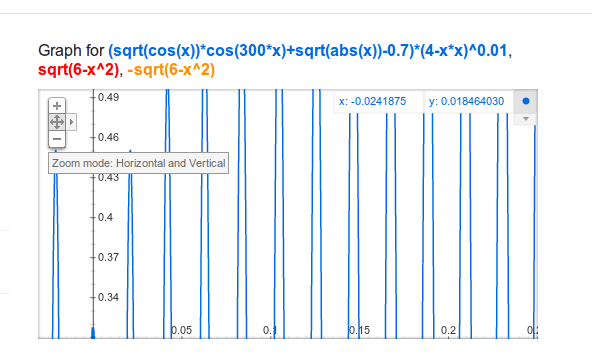
Replies
Welcome, guest
Join CrazyEngineers to reply, ask questions, and participate in conversations.
CrazyEngineers powered by Jatra Community Platform
-
@dancer-engineer-EJ8rGI • Feb 9, 2012
-
@anoop-kumar-GDGRCn • Feb 9, 2012
This one looks better:
Copy n paste in google
sqrt(cos(x))*cos(180x)+sqrt(abs(x))-0.7)*(4-x*x)^0.01, sqrt(6-x^2), -sqrt(6-x^2) from -4 to 4
hit enter -
@anoop-kumar-GDGRCn • Feb 9, 2012
There is warning in your code: The function might not be plotted correctly. 😛😁The_Big_KIf you want to impress your friends with your Google search abilities; enter the following search query in Google search bar and hit enter.
sqrt(cos(x))*cos(300x)+sqrt(abs(x))-0.7)*(4-x*x)^0.01, sqrt(6-x^2), -sqrt(6-x^2) from -4.5 to 4.5
☕ What gives? -
@thebigk • Feb 9, 2012
Looks like you didn't copy the complete code (there's a horizontal scrollbar). Or maybe Google doesn't heart you? 😒ianoopThere is warning in your code: The function might not be plotted correctly. 😛😁
Kidding! -
@praveenkumar-66Ze92 • Feb 9, 2012
This is kinda corrugated! Biggie's one was the BEST! 😛ianoopThis one looks better:
Copy n paste in google
sqrt(cos(x))*cos(180x)+sqrt(abs(x))-0.7)*(4-x*x)^0.01, sqrt(6-x^2), -sqrt(6-x^2) from -4 to 4
hit enter -
@circularsquare-CAswn0 • Feb 9, 2012
When I saw it at first I wracked my brains over how the plot is 'shaded'. Because by definition a function is such that for a particular value of x , there is only one value of y.
But I noticed that the image is a very zoomed out version of the plot. If you zoom in it has got closely spaced sine-like curve. The zoomed-out version of the plot & the closely-spaced zero crossings give an impression of 'shaded' region. So it is indeed a function with each value of x having at most one value of y.
Nice job.


