New Research Combines Machine Learning And Satellite Data To Map Out Poverty

In what could prove to be a real breakthrough for impoverished regions around the world, scientists from Stanford University have proposed an accurate way to identify poverty in areas previously void of valuable survey information. This was made possible through machine learning, extracting information about poverty from high-resolution satellite imagery. These improved poverty maps could certainly help aid organizations and policymakers distribute funds more efficiently and enact policies more effectively.
The researchers built upon their knowledge of few places in the world where one can tell the computer with certainty whether the people living there are rich or poor. They used the “nightlight†data to identify features in the higher-resolution daytime imagery that are correlated with economic development since the areas that are brighter at night are usually more developed. They fed the computer three data sources — night light images, daytime images, and actual survey data; to build an algorithm that predicts how rich or poor any given area is.
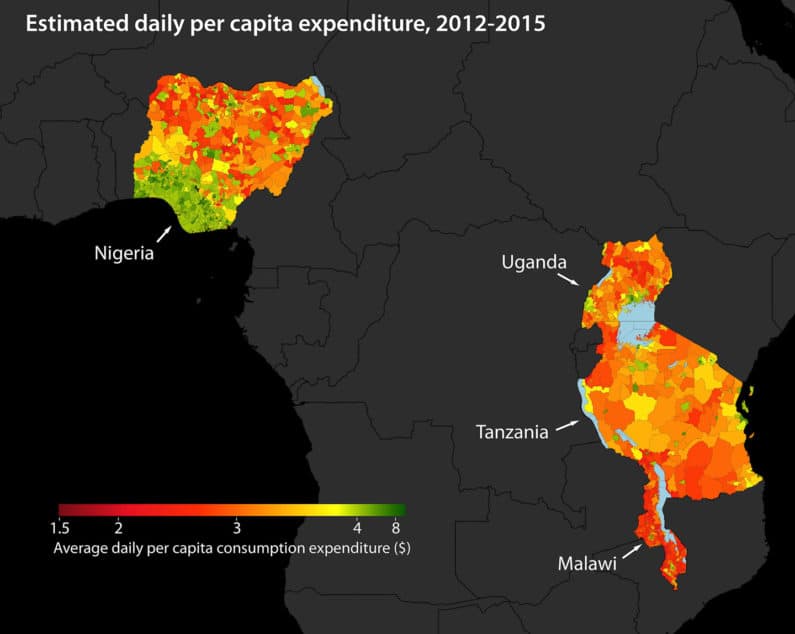
Building the algorithm took a two-step process called “transfer learning.†First, researchers showed a neural network daytime and night time images of five African countries: Uganda, Tanzania, Nigeria, Malawi, and Rwanda. Using deep learning techniques, they taught it to predict where night lights would be by looking at the daytime images and searching for correlations. For the second step, researchers used a different model called a ridge regression model, which already knows the connection between land features and lights.
The next step researchers feel is to upgrade the model to work on other countries and better map the poverty across the world. The findings were published in the journal #-Link-Snipped-#.
Source:<a href="https://news.stanford.edu/2016/08/18/combining-satellite-data-machine-learning-to-map-poverty/" target="_blank" rel="nofollow noopener noreferrer">Stanford scientists combine satellite data, machine learning to map poverty | Stanford News</a>
The researchers built upon their knowledge of few places in the world where one can tell the computer with certainty whether the people living there are rich or poor. They used the “nightlight†data to identify features in the higher-resolution daytime imagery that are correlated with economic development since the areas that are brighter at night are usually more developed. They fed the computer three data sources — night light images, daytime images, and actual survey data; to build an algorithm that predicts how rich or poor any given area is.
Building the algorithm took a two-step process called “transfer learning.†First, researchers showed a neural network daytime and night time images of five African countries: Uganda, Tanzania, Nigeria, Malawi, and Rwanda. Using deep learning techniques, they taught it to predict where night lights would be by looking at the daytime images and searching for correlations. For the second step, researchers used a different model called a ridge regression model, which already knows the connection between land features and lights.
The next step researchers feel is to upgrade the model to work on other countries and better map the poverty across the world. The findings were published in the journal #-Link-Snipped-#.
Source:<a href="https://news.stanford.edu/2016/08/18/combining-satellite-data-machine-learning-to-map-poverty/" target="_blank" rel="nofollow noopener noreferrer">Stanford scientists combine satellite data, machine learning to map poverty | Stanford News</a>
0