New GRE 2011 Data Interpretation Sample Questions


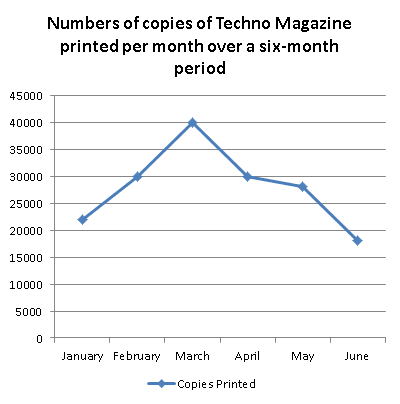
1. Which of the following can be correctly deduced from the data? (Select ALL that apply)
A. The total number of Techno magazines printed over the given 6-month period was less than 200,000
B. In May approximately 28,000 copies of Techno magazine were sold
C. The average (arithmetic mean) monthly number of copies of Techno printed in this period was less than 30,000
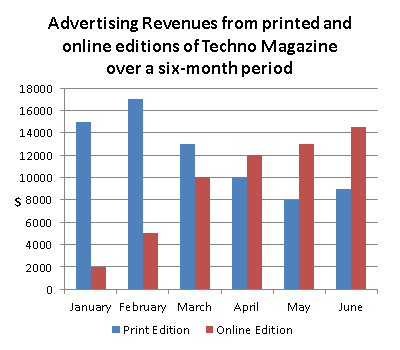
2. Between which two of the months shown was there a twenty percent rise in online advertising revenues?
A. January and February
B. February and March
C. March and April
D. April and May
E. May and June
3. If in February each magazine printed cost $1.50 to produce, which of the following is closest to the fraction of the production costs that were covered by the advertising revenues from the print version?
A. 1/5
B. 2/5
C. 3/5
D. 4/5
E. 9/10
4. The total advertising revenues (printed version + online version) were highest in which of the following months?
A. February
B. March
C. April
D. May
E. June
5. During the six-month period shown, the median number of copies printed per month was most nearly
A. 30,000
B. 29,000
C. 28,000
D. 25,000
E. 22,000
SOLVE THESE QUESTIONS HERE.
Answers will be discussed within few days.
