
Apps Are More Likely To Crash On Google’s Android Gingerbread & Apple’s iOS 6: Study
@satya-swaroop-YDeBJM
•
Oct 22, 2024
Oct 22, 2024
1.6K
Crittercism, a mobile application performance management solution company based out of San Francisco has conducted a study to find out the variables that determine the performance of a mobile app. The company has gathered data from over one billion smartphone and tablet users in the world and analysed three billion events over a period of thirty days. The findings of their reports have been stated in a Q&A format in the following paragraphs below.
Why Does An App Fail?
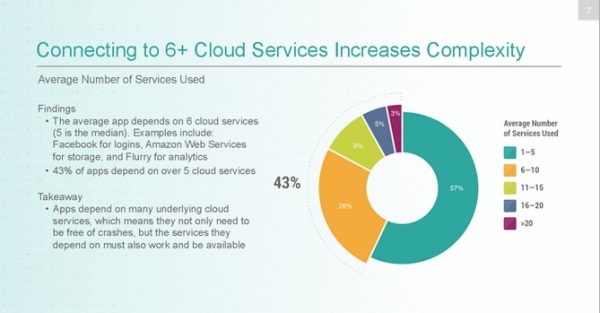
Crittercism starts off the report by asking us to see what goes on underneath every app. Every app that is being developed has to work on over 2500 devices which are powered by one of the 100+ operating system versions and they operate on one of the 691 cellular service provider networks. These variables create over a 100 million permutations which makes for a complex ecosystem for the app to function. One of the most critical reasons that affect an app’s performance is its dependence on cloud services. An app often depends on cloud services such as Facebook for logins, Amazon Web Services for storage, and Flurry for analytics. An average app depends on six cloud services and this means that if the cloud service that they depend on fails or responds slowly the performance of the app is affected.
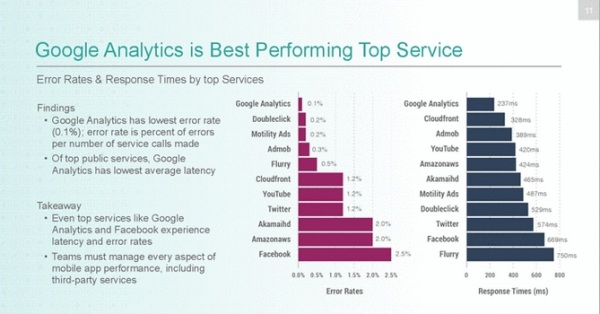
The parameters on which the performances of the cloud services were judged in the study were error rates and latency. While users expected these services to respond within a second, 9% of then had a latency of over one second. Out of all the service calls made to these services from mobile apps 21% had error rates of over 1% and 18% of those calls had error rates of over 5%. Google Analytics managed to secure the best position in terms of error rates and latency times and Facebook and Flurry came at the bottom of the respective tables.
The response times of these services were also affected by geography. Canada managed to secure the best response time at 0.8X of US response times (response time were normalised to US ) and India managed to rank the last as it took over twice as much time to respond as they did in the US.
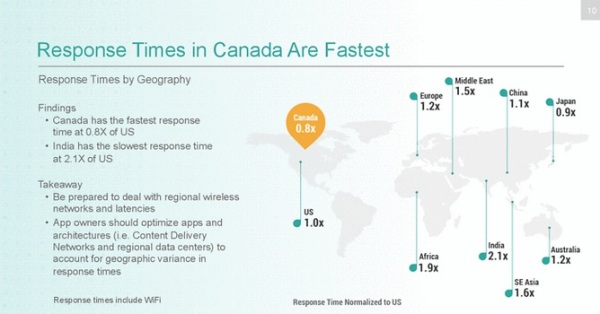
Crittercism wants developer to pay attention to these findings and develop apps which take in account regional service providers and latency times. They should also optimise apps to take advantage of regional data centres and content delivery systems to ensure that their apps perform faster.
How Well Does An App Work on Android?
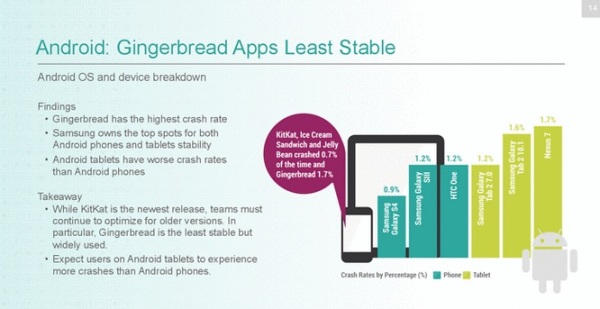
When it comes to Google’s Android, apps are most likely to crash in Android 2.3 (Gingerbread). Samsung device owners now have a reason to rejoice because the smartphones and tablets made by the Korean manufacturer have managed to secure the top position in the stability table. The most interesting finding in the Android section was that Android tablets are twice as likely to crash as compared to their smartphone counterparts.
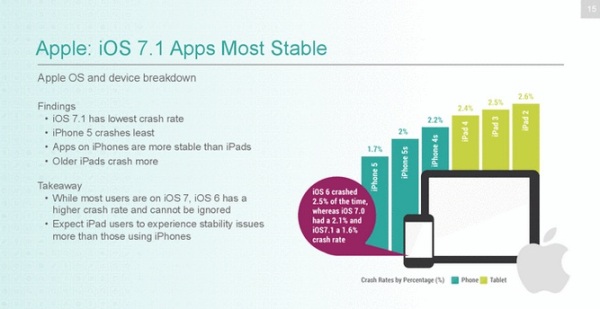
How Well Does An App Work on iOS?
In the iOS findings we find a similar trend. Apps are more stable on iPhones as compared to iPads. There is now a good reason for everyone to update to iOS 7 because it has been ranked as the most stable operating system. A word of caution to everyone who is rushing to buy older iPads which are being sold at cheaper rates on regional retailers because they are more likely to crash your apps as compared to the newer models.
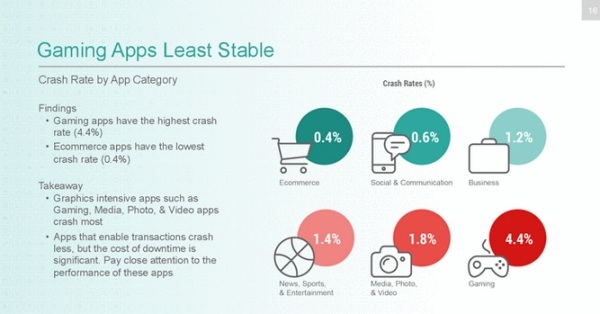
Apps Belonging To Which Category Work The Best?
The report finds out that e-commerce apps are the most stable apps as they have a crash rate of 0.4%. E-commerce apps are followed by social networking and business apps with have crash rates of 0.6% and 1.2% respectively. Graphics intensive apps managed to find themselves at the bottom of the table with gaming apps ranking the worst in terms of stability with a crash rate of 4.4%. News, sports and entertainment apps managed rank above the gaming apps with a crash rate of 1.4% and photo, video and media streaming narrowly avoided the fate of being at the bottom as they crashed 1.8% of the time.
If you are hungry for the detailed report, head over to the <a href="https://www.documentcloud.org/documents/1097982-state-of-mobile-performance.html#document/" target="_blank" rel="nofollow noopener noreferrer">DocumentCloud</a> and its coverage #-Link-Snipped-#.
Why Does An App Fail?
Crittercism starts off the report by asking us to see what goes on underneath every app. Every app that is being developed has to work on over 2500 devices which are powered by one of the 100+ operating system versions and they operate on one of the 691 cellular service provider networks. These variables create over a 100 million permutations which makes for a complex ecosystem for the app to function. One of the most critical reasons that affect an app’s performance is its dependence on cloud services. An app often depends on cloud services such as Facebook for logins, Amazon Web Services for storage, and Flurry for analytics. An average app depends on six cloud services and this means that if the cloud service that they depend on fails or responds slowly the performance of the app is affected.
The parameters on which the performances of the cloud services were judged in the study were error rates and latency. While users expected these services to respond within a second, 9% of then had a latency of over one second. Out of all the service calls made to these services from mobile apps 21% had error rates of over 1% and 18% of those calls had error rates of over 5%. Google Analytics managed to secure the best position in terms of error rates and latency times and Facebook and Flurry came at the bottom of the respective tables.
The response times of these services were also affected by geography. Canada managed to secure the best response time at 0.8X of US response times (response time were normalised to US ) and India managed to rank the last as it took over twice as much time to respond as they did in the US.
Crittercism wants developer to pay attention to these findings and develop apps which take in account regional service providers and latency times. They should also optimise apps to take advantage of regional data centres and content delivery systems to ensure that their apps perform faster.
How Well Does An App Work on Android?
When it comes to Google’s Android, apps are most likely to crash in Android 2.3 (Gingerbread). Samsung device owners now have a reason to rejoice because the smartphones and tablets made by the Korean manufacturer have managed to secure the top position in the stability table. The most interesting finding in the Android section was that Android tablets are twice as likely to crash as compared to their smartphone counterparts.
How Well Does An App Work on iOS?
In the iOS findings we find a similar trend. Apps are more stable on iPhones as compared to iPads. There is now a good reason for everyone to update to iOS 7 because it has been ranked as the most stable operating system. A word of caution to everyone who is rushing to buy older iPads which are being sold at cheaper rates on regional retailers because they are more likely to crash your apps as compared to the newer models.
Apps Belonging To Which Category Work The Best?
The report finds out that e-commerce apps are the most stable apps as they have a crash rate of 0.4%. E-commerce apps are followed by social networking and business apps with have crash rates of 0.6% and 1.2% respectively. Graphics intensive apps managed to find themselves at the bottom of the table with gaming apps ranking the worst in terms of stability with a crash rate of 4.4%. News, sports and entertainment apps managed rank above the gaming apps with a crash rate of 1.4% and photo, video and media streaming narrowly avoided the fate of being at the bottom as they crashed 1.8% of the time.
If you are hungry for the detailed report, head over to the <a href="https://www.documentcloud.org/documents/1097982-state-of-mobile-performance.html#document/" target="_blank" rel="nofollow noopener noreferrer">DocumentCloud</a> and its coverage #-Link-Snipped-#.